


10/12 - Georgia’s Changing Demographics
A look at what the voter file can tell us about the future of the state

Intro
Today is one of the most consequential days of early voting; it is the first day that people will be able to cast their ballot in-person at early voting locations. In 2016, over 90,000 people took advantage of this option on the first day. On the final day of early voting in 2016 over 250,000 people went to vote. Our expectation is that we’ll see a number closer to that second one today.
With votes about to come pouring in, we’ve made some updates to the georgiavotes.com website. Every view now defaults to vote totals, however you will still be able to toggle over to view application information both statewide and at the county level. We’re also displaying a lot more information about the legislative races, as you can see below:
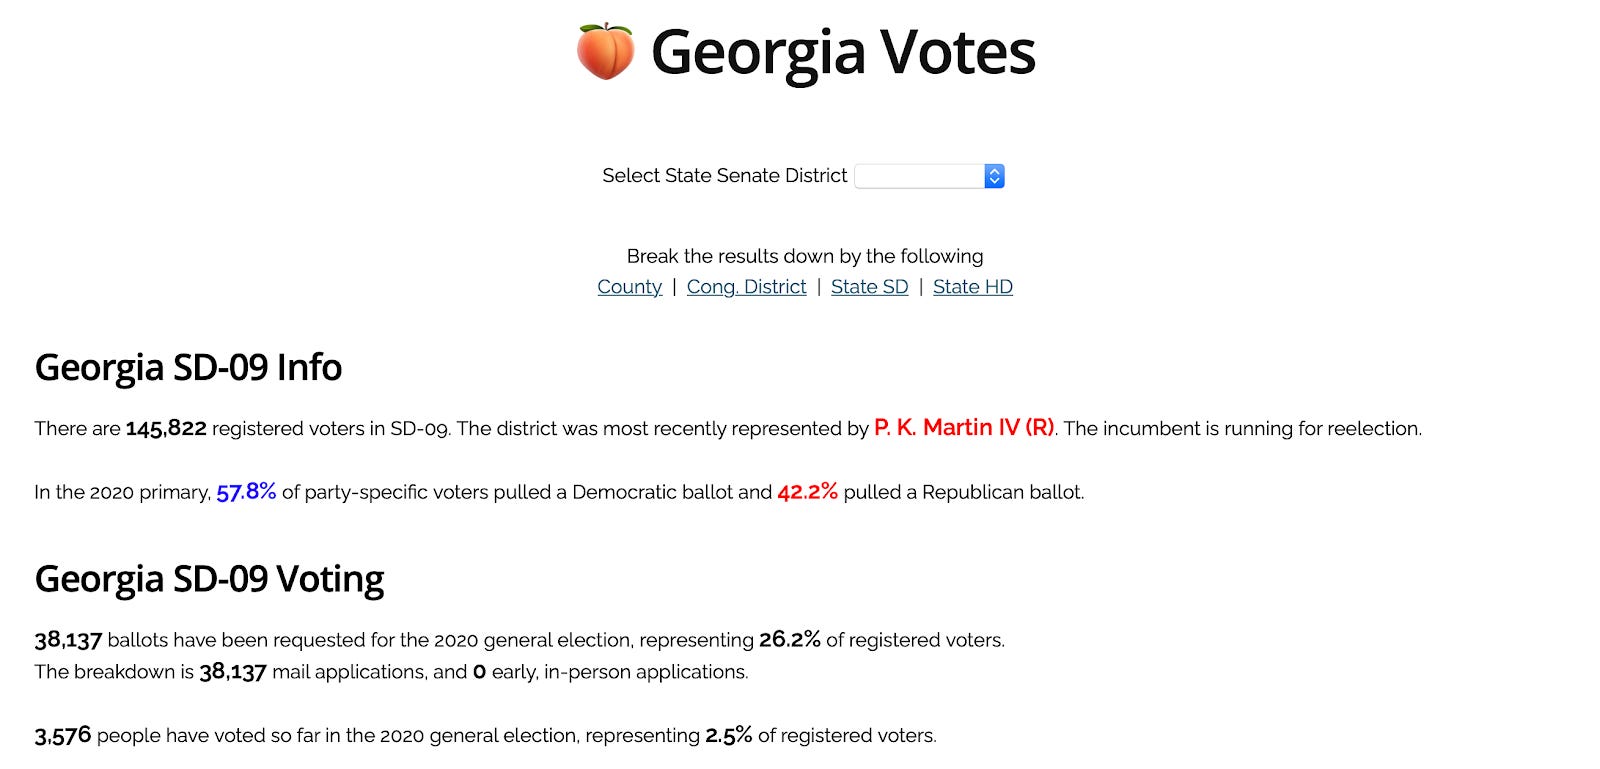
And this isn’t done yet. Even with only 3 more weeks to go there are a few more updates to be made, so keep an eye out.
Age, Race and Partisan Lean
As you are well aware, the state of Georgia makes available a lot of useful data about voting. The only thing keeping anyone from understanding what it can telling us is having the time to really dig in. Today we wanted to walk you through what that data says about demographic shifts in Georgia.
There is a popular saying that “Demographics is Destiny.” While often attributed to Auguste Comte, the true sources are likely Richard Scammon and Ben Wattenberg, who used it as a title of a chapter to their book The Real Majority. We’ll let the political science PhDs argue over how true that statement is, but what we can clearly see right now is how the demographic tides have been turning in Georgia.
Looking through the voter file we were able to break down 3 different measures to understand the registered voter population. First, we look at race and age; specifically, the percentage of registered voters in each age bracket who are white.
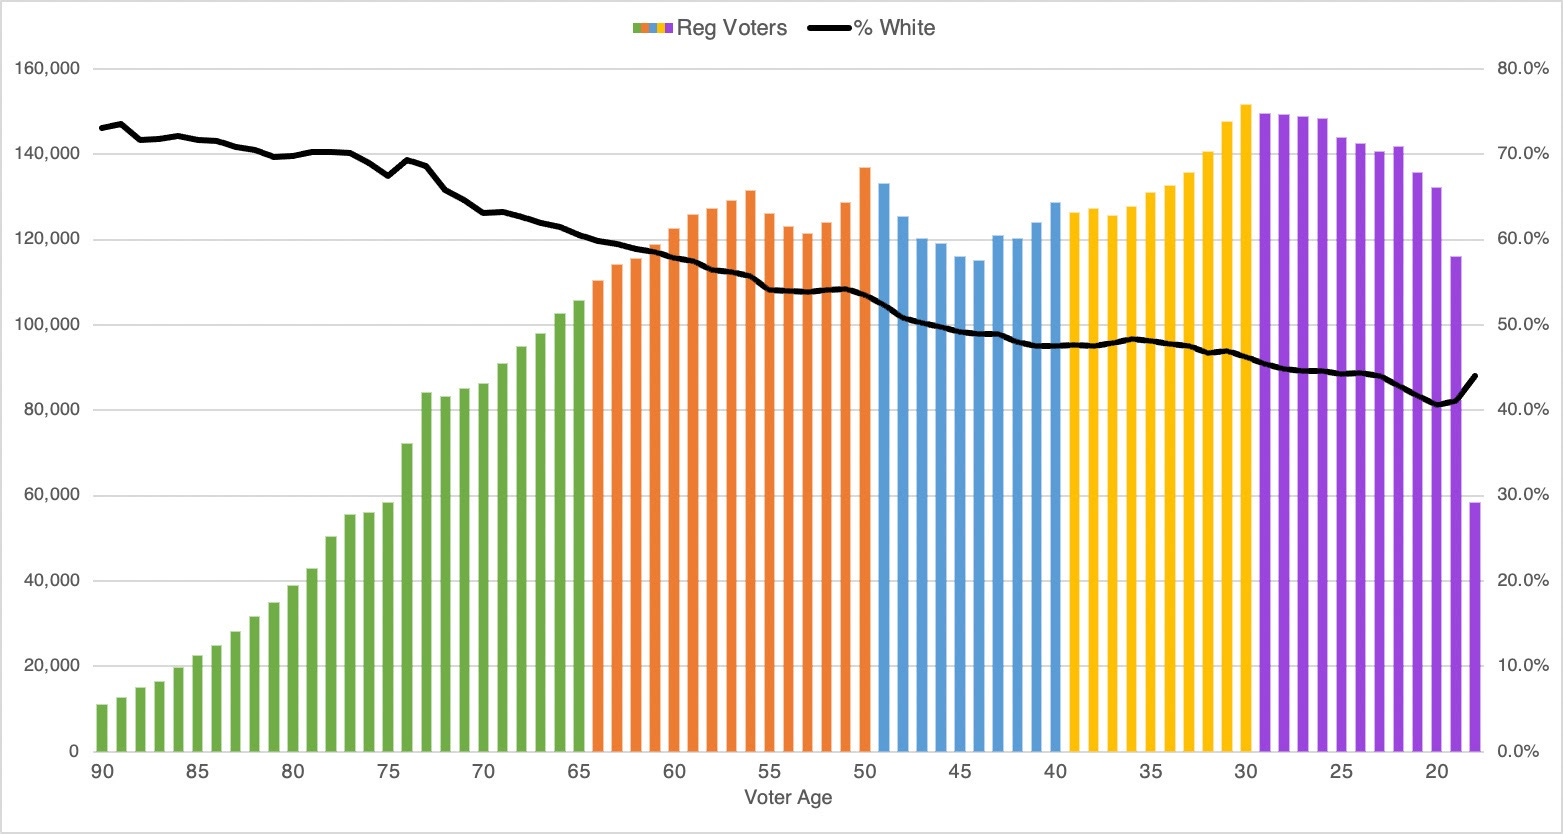
Two things stand out in this chart:
Just how many young people are registered to vote. The top-10 birthyears for registered voters in Georgia are all between 1989 and 1998.
How diverse this young generation of voters is. Every birthyear of voters going back to 1974 is majority non-white according to the voter file. This may be a little skewed given the ‘Unknown’ flag comprises about 9% of the voter file, but the overall trend is clear.
Given the general voting preferences of people of color, this chart would appear to imply that the younger generation should be more likely to vote Democratic. Young voters, when they show up to vote, have often been a key constituency of the Democratic Party so this would not come as much of a surprise. Thankfully, with the State’s data, we are able to measure this as well.
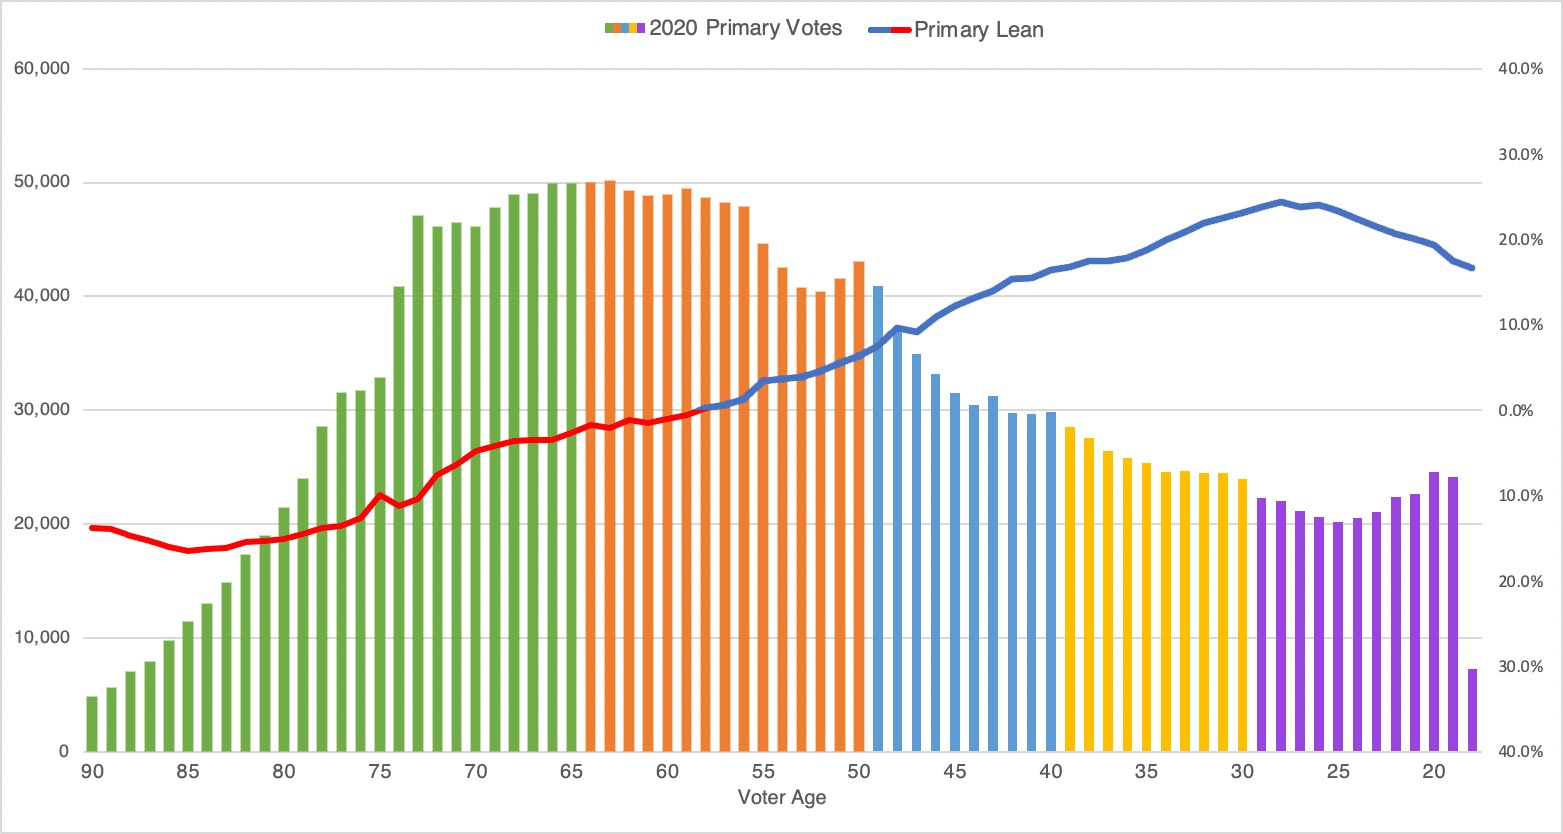
In Georgia you do not have to register with a party when you register to vote. So without that data we have to come up with different ways to measure partisan lean. One option is by looking at which party ballots people use when they vote in primaries. We went back and looked at every primary ballot pulled since 2012, bucketed them by birthyear, and then mapped out their partisan lean.

The story is largely the same here. We still see increased Democratic lean among younger voters, but now the breaking point is only around 35 years old instead of 46.
This measure certainly has its negatives too. For instance, primary turnout is significantly lower than general election turnout, especially among younger voters. Also, going back 3 presidential cycles may skew this data a little more favorably for Republicans given the shifts we’ve seen in the last 5 years among suburban voters.
To get a bit more clarity we wanted to look at one final data point: the 2020 primary.
Over 2 million people voted in the 2020 primary, by far the most ever for a Georgia primary. And since every registered voter in the state received an application for a mail-in ballot we don’t have to spend too much time trying to factor in the impact of long lines or precinct closures on voting behavior. Instead, we can just look at the number of voters in each age group, and how their primary ballot of choice broke between Republicans and Democrats.
And this is what we get.
In June, every age group up to 58 year olds was more likely to choose a Democratic ballot than a Republican one. And the size of the partisan lean was also significantly more than we saw in the prior chart. While only voters aged 18-22 had a lean of at least D+10 in the first sample, this June we saw D+10 extend all the way through 46 year olds. Tantalizing numbers for a Democratic Party hoping to see themselves retake the majority in the State House.
But we also see the other key story demographics tell: who actually shows up to vote. The average number of registered voters in a Baby Boomer birthyear is just over 105,000. For Gen-X that number is 123,800, and for both Millenials and Gen-Z it is around 137,000. And yet, when you look at this chart, Baby Boomers (56-74 years old) more than doubled the turnout of almost every Millenial or Gen-Z birthyear.
It doesn’t matter what your registered voter numbers look like if you don’t actually show up to vote. These numbers are a reminder that the current losses among Republicans may be short lived if the 50+ year old voters swing back to the right and young voters don’t start showing up at the polls.
Closing
This was a lot of stuff today and we really didn’t dig into any races. Hopefully this was an enjoyable little sidebar, because once the file hits tonight I think we’re going to be awash in new narratives that will keep us plenty busy until Nov 3rd.
Thanks again for taking the time to read this, and please continue to reach out with any questions, comments, or feedback.